Insights
Insights are the primary way to create persistent visualizations and analyses in Altertable. They are saved analytics views that help you track key metrics, understand user behavior, and make data-driven decisions.
What are Insights?
Insights transform raw data into actionable visualizations by:
- Querying your lakehouse data using predefined logic
- Supporting multiple visualization types (charts, tables, metrics)
- Refreshing automatically or on-demand
- Being shareable with teams and embeddable in external tools
Prerequisites: Insights analyze data in your lakehouse. Start by connecting catalogs or creating a managed Altertable catalog. If you want product-behavior insight types such as Funnel, Retention, or Segmentation, first enable Product Analytics, then track events and identify users.
Goals of Insights
- Track metrics over time: Monitor KPIs and business metrics continuously
- Understand behavior: Analyze user actions, conversions, and engagement
- Compare segments: Identify differences between user cohorts
- Inform decisions: Provide data-driven answers to business questions
Insight Types
Altertable offers several insight types, each tuned to a different analysis need.
Funnel, Retention, and Segmentation insights rely on Product Analytics data in the current environment. Semantic and SQL insights work with any lakehouse data you can query.
Insight Type | Best For | Key Feature | When to Use |
|---|---|---|---|
Conversion analysis | Multi-step progression tracking | Analyze sequential user flows | |
Cohort return over time | Starting vs returning event curves | Measure repeat behavior after a cohort event | |
Cohort analysis | Group users by behavior | Compare different user groups | |
Business metrics | No-SQL query builder | KPI dashboards and reports | |
Custom analysis | Full query flexibility | Complex or ad-hoc queries |
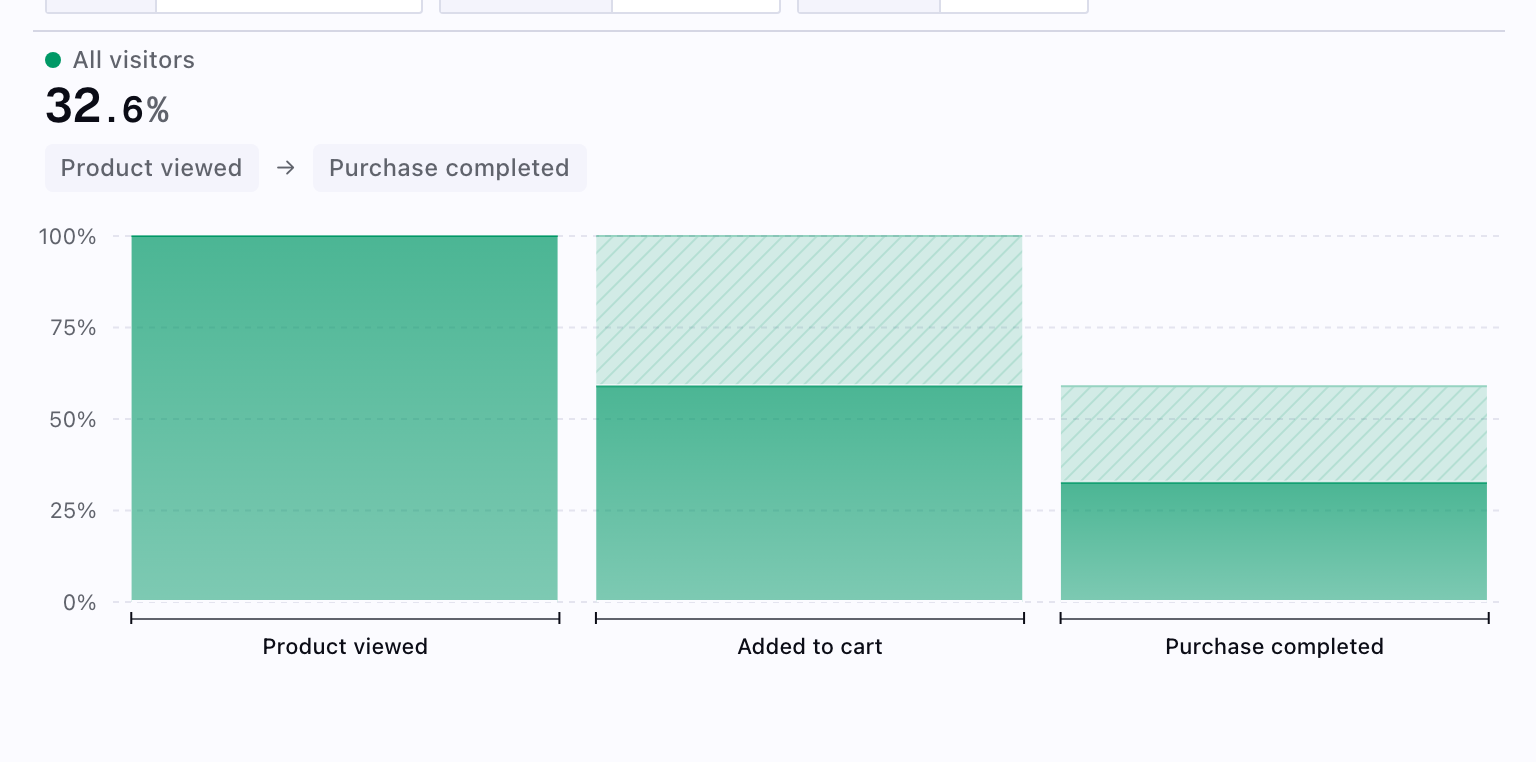
1. Funnel Insights
Track user progression through sequential events to measure conversion rates and identify drop-offs.
Best for:
- Signup and onboarding flows
- Checkout and purchase processes
- Feature adoption journeys
- Multi-step workflows
Key metrics:
- Step-by-step conversion rates
- Overall funnel completion
- Drop-off points and rates
- Time to convert between steps
Common examples:
- Signup funnel: Landing page → Signup form → Email verification → Profile completed
- Checkout funnel: Product viewed → Added to cart → Checkout started → Purchase completed
- Feature adoption: Feature discovered → Feature clicked → Feature configured → Feature used
2. Retention Insights
Measure how groups that perform a starting event come back and perform a returning event across time buckets (classic cohort retention curves).
Best for:
- Onboarding and activation follow-up
- Repeat usage after a milestone event
- Comparing retention across segments defined in Segmented by
Key options:
- Measured as — return on a specific period only, or on that period or later
- Calculated by — 24-hour windows vs strict calendar day alignment
Learn more about retention insights →
3. Segmentation Insights
Group users into cohorts based on behavioral patterns and analyze differences between segments.
Best for:
- User cohort analysis
- Comparative behavior studies
- Engagement level tracking
- Comparing metrics across segments (for dedicated cohort retention curves, use Retention)
Common segments:
- By activity level (power users, regular users, casual users)
- By feature usage (adopters, explorers, unaware)
- By purchase behavior (recent, repeat, one-time)
- By acquisition channel or demographics
Example segments:
- Engagement: Users segmented by sessions per month (20+, 10-20, 1-10, inactive)
- Feature adoption: Users who adopted vs explored vs never used a feature
- Revenue: High-value, medium-value, low-value customers based on spend
Learn more about segmentation →
4. Semantic Insights
Query structured data models using business-friendly metrics and dimensions without writing SQL.
Best for:
- Business metric reporting
- KPI dashboards
- Cross-functional analytics
- Model-based queries
Key features:
- Pre-defined metrics (revenue, DAU, conversion rate)
- Reusable dimensions (region, plan type, category)
- No SQL knowledge required
- Centralized business logic
Key properties:
- Consistency: Shared metric definitions across teams
- Accessibility: Query without writing SQL
- Governance: Centralized business logic
- Reusability: Define once, reuse across dashboards and reports
Learn more about semantic insights →
5. SQL Insights
Execute custom SQL queries using DuckDB dialect for complete flexibility in data analysis.
Best for:
- Complex custom queries
- Ad-hoc analysis
- Advanced calculations (window functions, CTEs)
Capabilities:
- Full DuckDB SQL dialect support
- Cross-catalog federated queries
- Advanced analytics functions (window functions, CTEs, recursive queries)
- Complete query flexibility
Use cases:
- Custom retention calculations with specific business rules
- Complex multi-source joins (product events + CRM + revenue data)
- Advanced cohort analysis with custom time windows
- Performance analysis with moving averages and percentiles
Learn more about SQL insights →
Quick Decision Guide
Start with Funnels when:
- Tracking multi-step processes
- Measuring conversion rates
- Finding drop-off points
Use Segmentation when:
- Comparing user groups
- Analyzing cohort behavior
- Understanding engagement levels
Use Retention when:
- Measuring return after a specific starting event
- Plotting cohort survival over day or period offsets
- You need Return on vs Return on or after semantics
Choose Semantic when:
- Reporting standard business metrics
- Building KPI dashboards
- Enabling non-technical users
Go with SQL when:
- You need custom calculations
- You join multiple data sources
- You explore data ad hoc
Learn More
Use these pages to choose an insight type and configure it:
- Funnel Insights: Track user progression through sequential events
- Retention Insights: Cohort retention from a starting and returning event
- Segmentation Insights: Group users into cohorts based on behavior
- Semantic Insights: Query structured data models without SQL
- SQL Insights: Execute custom SQL queries for complete flexibility
- Product Analytics: Set up event tracking and user identification
- Analytical Database: Query your lakehouse with SQL
- Architecture: Understand Altertable's infrastructure
- AI Agents: Automate analytics with AI