
A model release, a benchmark thread, and a thread about why the benchmarks are wrong can all be on the front page at once.
Hacker News is a good place to experience this cycle. We wanted to know whether it has a predictable rhythm: how many AI-related stories will people submit next week?
Naturally, we asked AI.
We took just over a million Hacker News submissions, used Jev to classify their titles, and fed the daily counts to our Timestral extension for DuckDB. One model decides what counts as AI. Another predicts how much more of it is coming. We can inspect every step in SQL.
The forecast beats our weekly baseline. It also misses Christmas quite spectacularly.
First, count the chatter
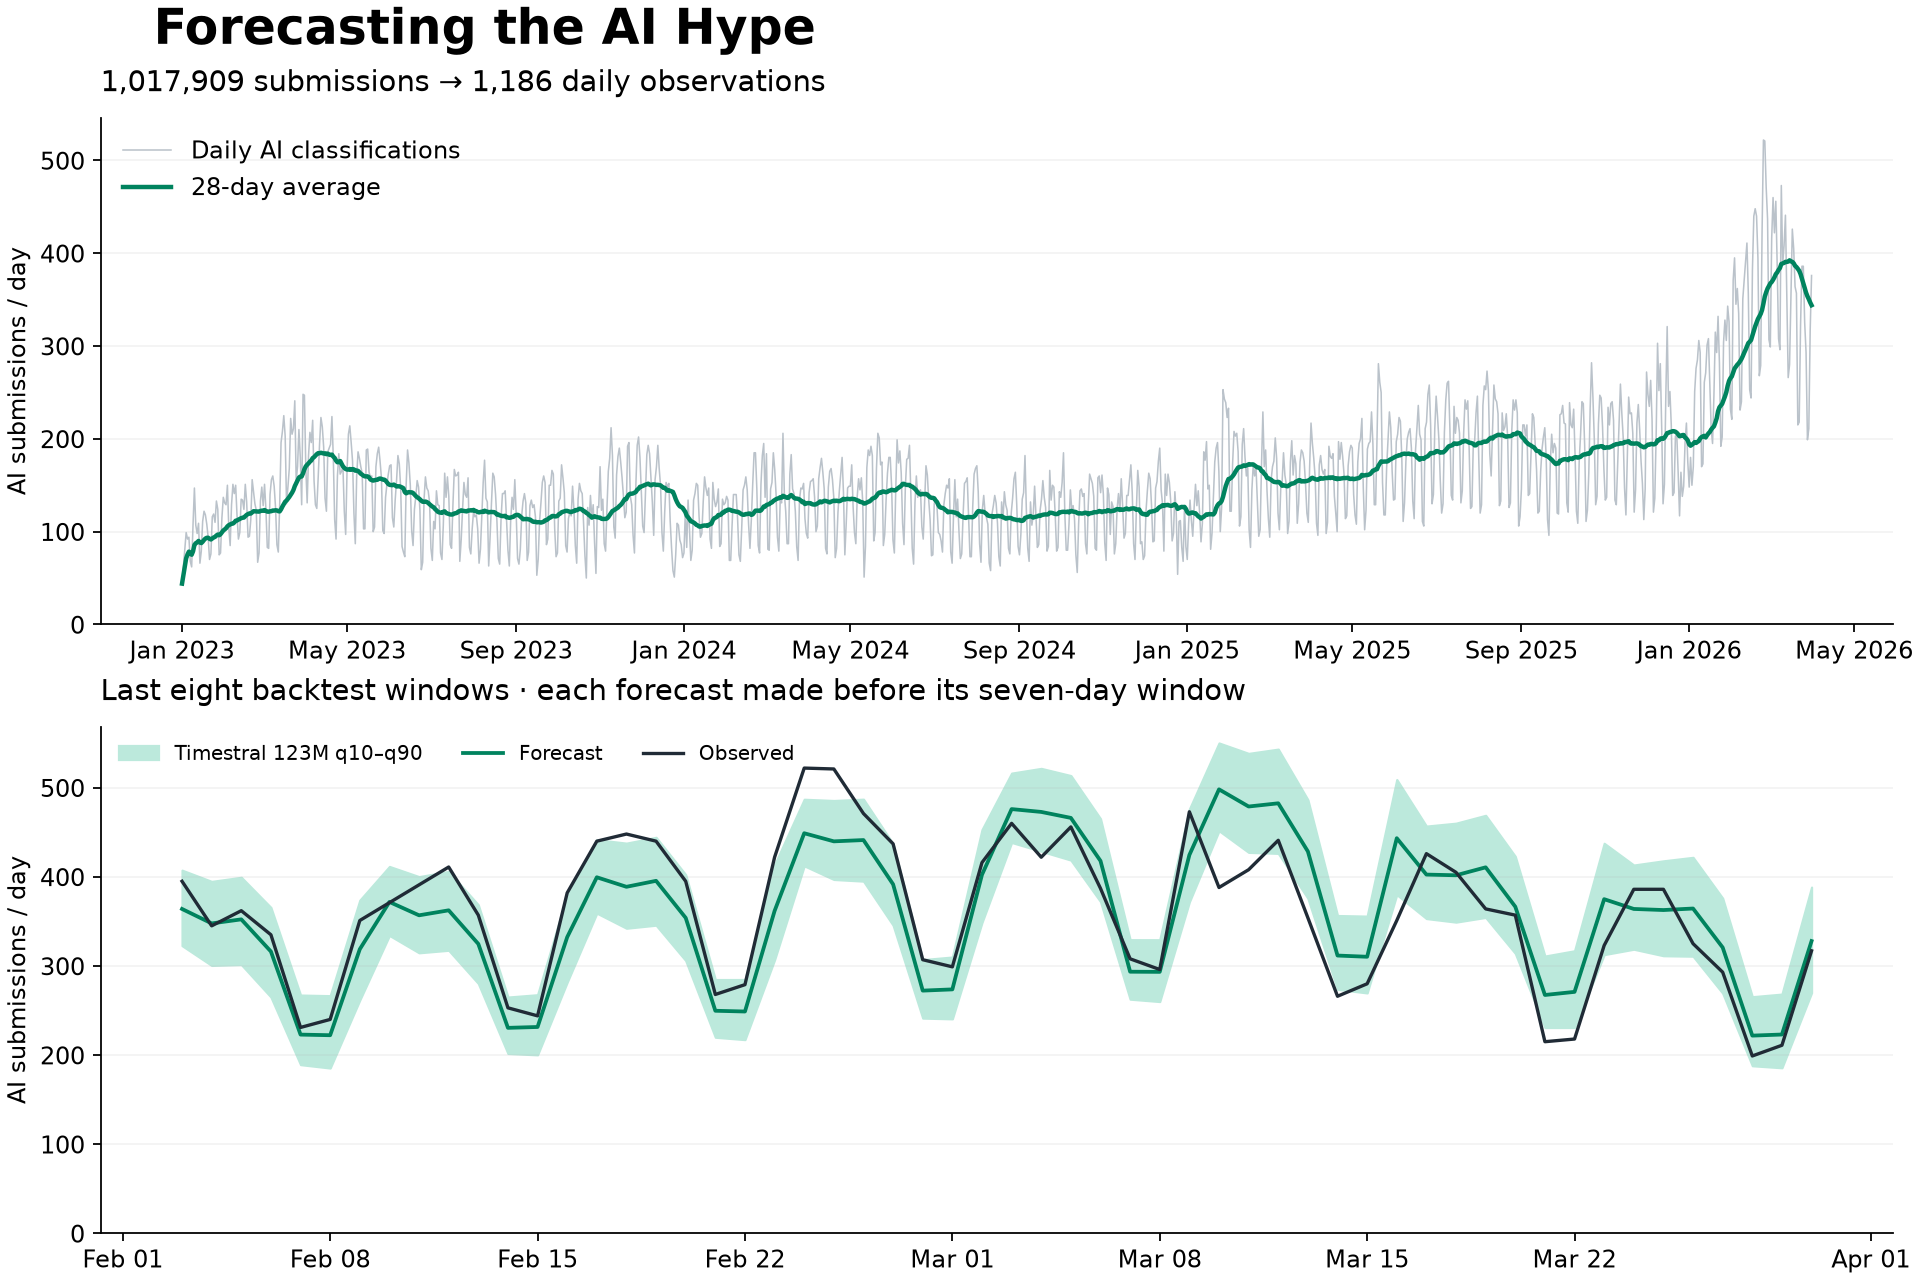
The public Hacker News archive comes as monthly Parquet files. We use a pinned snapshot covering January 2023 through March 2026: 1,017,909 submissions across 1,186 consecutive days. March is the last complete month in that snapshot; we use this history to test predictions against known outcomes.
Each submission contributes an ID, a UTC date, and a title. We keep stories with nonempty titles, exclude deleted records, and deduplicate by ID. Repeat submissions with different IDs still count. These are submissions across HN, including stories that never reach the front page. We do not count comments or use final scores to decide which stories deserve to exist in the dataset.
Jev lets us state the classification rule directly. Its DuckDB extension sends the title to TypeSafe's API and returns a probability:
LOAD jev;SET jev_model = 'jev-1.14.0';SET jev_batch_size = 10;CREATE TABLE title_scores ASSELECTtitle,jev_prob(struct_pack(title := title),'The title is primarily about artificial intelligence or machine learning, including AI models, AI tools, AI research, or the societal and business effects of AI. A passing mention or an unrelated person, animal, protocol, or company sharing a model name is not enough.') AS ai_probabilityFROM (SELECT DISTINCT title FROM stories);CREATE VIEW labelled_stories ASSELECT id, day, ai_probabilityFROM storiesJOIN title_scores USING (title);
We score each distinct title once and save the result, then join it back to the original submissions. The full pass evaluates 938,736 titles for an estimated $3.11.
Here are four examples from the saved output:
| Title | AI probability |
|---|---|
| A.I. Driven Smoke Testing | 0.80 |
| Claude Artifacts – A Deep Dive | 0.78 |
| Stop Certificate Pinning (2020) | 0.02 |
| The perils of GenAI student submissions | 0.91 |
We use a fixed threshold of 0.5. Before the full pass, we checked a 352-title sample, including random submissions from each month and ambiguous model names. Jev agreed with 326 of 332 clear labels from our assistant-reviewed sample; 20 titles were too ambiguous to score. That is a useful spot check, not a human-validated accuracy benchmark.
Download the daily counts to follow along with the forecasting queries.
Give the hype a frequency
The classifier produces 188,140 AI-related submissions. Now we need a regularly spaced numerical series:
CREATE VIEW daily ASSELECTday,count(*) AS submissions,count(*) FILTER (WHERE ai_probability >= 0.5) AS ai_submissions,round(100.0 * ai_submissions / submissions, 2) AS ai_pctFROM labelled_storiesGROUP BY day;SELECT * FROM dailyWHERE day BETWEEN DATE '2026-03-17' AND DATE '2026-03-23'ORDER BY day;
| day | submissions | ai_submissions | ai_pct |
|---|---|---|---|
| 2026-03-17 | 1,338 | 426 | 31.84 |
| 2026-03-18 | 1,268 | 405 | 31.94 |
| 2026-03-19 | 1,171 | 364 | 31.08 |
| 2026-03-20 | 1,173 | 357 | 30.43 |
| 2026-03-21 | 733 | 215 | 29.33 |
| 2026-03-22 | 787 | 218 | 27.70 |
| 2026-03-23 | 1,107 | 323 | 29.18 |
There is already a recognizable pattern: fewer submissions over the weekend, then a return on Monday. Even AI discourse observes something resembling office hours.
Across March, the classifier labels 31.2% of submissions as AI-related. That puts the volume in context; the value we forecast is the daily count, ai_submissions. Every date in the period is present, so there are no missing days to fill or interpret as zero.
These are counts of classified titles. The model can miss an obscure tool name or misunderstand a short headline. Keeping its definition fixed gives us a consistent measurement to forecast; it does not turn that measurement into a perfect census.
Seven days in one query
Mistral's Timestral is a pretrained model for numerical time series. Our extension runs it locally on CPU through ONNX Runtime. There is no training step for this dataset and no forecasting API to call.
Let's hide a week we can check. We give the model the 365 days before March 24 and ask for the next seven:
WITH history AS (SELECT day, ai_submissionsFROM dailyWHERE day >= DATE '2025-03-24'AND day < DATE '2026-03-24')SELECTday::DATE AS day,round(forecast, 1) AS forecast,round(q10, 1) AS q10,round(q90, 1) AS q90FROM history TIMESTRAL_FORECAST (ai_submissionsORDER BY dayHORIZON 7EVERY INTERVAL '1 day'USING MODEL '5m')ORDER BY day;
| day | forecast | q10 | q90 |
|---|---|---|---|
| 2026-03-24 | 366.8 | 322.3 | 411.7 |
| 2026-03-25 | 360.9 | 311.7 | 413.7 |
| 2026-03-26 | 363.3 | 311.3 | 420.6 |
| 2026-03-27 | 323.0 | 268.6 | 381.1 |
| 2026-03-28 | 228.7 | 182.9 | 275.9 |
| 2026-03-29 | 228.6 | 181.8 | 276.1 |
| 2026-03-30 | 322.0 | 263.4 | 385.1 |
That is the complete forecast query. HORIZON 7 asks for seven observations; EVERY INTERVAL '1 day' gives them their frequency. The result is seven rows, ready to join, chart, or export. We do not need to create a forecast table.
forecast is the median prediction. q10 and q90 mark the model's nominal central 80% range. The extension returns 21 quantiles; we show two to keep the table readable. Fractional submissions are numerical predictions, not an attempt to publish half a Show HN.
The weekly dip is visible in the output. Timestral has no story titles, release announcements, or opinions about whether coding agents are overhyped. It gets dates and counts.
Give the larger models a turn
Timestral comes in 5M, 28M, 123M, and 209M sizes. Changing the model takes one option: USING MODEL '123m'.
One week is an example, not an evaluation. We repeat the exercise at 52 weekly starting points, from April 1, 2025 through March 24, 2026. Each forecast uses the preceding 365 days and predicts the next seven. That gives us 364 distinct target days, with exactly the same history and targets for every size.
The aggregate form makes it possible to evaluate all those windows together:
WITH origins AS (SELECT unnest(generate_series(DATE '2025-04-01',DATE '2026-03-24',INTERVAL '7 days'))::DATE AS origin)SELECTorigin,unnest(timestral_forecast(ai_submissions ORDER BY dayHORIZON 7 EVERY INTERVAL '1 day'USING MODEL '123m'), recursive := true)FROM originsJOIN daily ON day >= origin - 365 AND day < originGROUP BY origin;
The day < origin condition keeps the target week out of each history. We join the returned dates to the actual counts afterward. Here is the final window for 123M, rounded for display:
| day | forecast | observed | same weekday last week |
|---|---|---|---|
| 2026-03-24 | 364.0 | 386 | 426 |
| 2026-03-25 | 362.7 | 386 | 405 |
| 2026-03-26 | 364.4 | 325 | 364 |
| 2026-03-27 | 320.7 | 293 | 357 |
| 2026-03-28 | 221.8 | 199 | 215 |
| 2026-03-29 | 223.1 | 211 | 218 |
| 2026-03-30 | 327.9 | 317 | 323 |
Our main baseline simply repeats the count from the same weekday last week. We also try the mean of the previous four matching weekdays, the previous week's daily mean, and the last observed value. All use only information available before the forecast starts.
Across all 364 target days:
| Model or baseline | Mean absolute error, posts/day |
|---|---|
| Timestral 5M | 23.14 |
| Timestral 28M | 22.64 |
| Timestral 123M | 22.39 |
| Timestral 209M | 22.50 |
| Same weekday last week | 25.38 |
| Mean of four matching weekdays | 28.21 |
| Previous seven-day mean | 45.16 |
| Last observed value | 46.09 |
All four sizes beat the strongest baseline. The 123M model reduces mean absolute error by 11.8%, from 25.38 to 22.39 submissions per day. The small model gets most of the benefit: going from 5M to 123M improves the average error by less than one post a day.
The 209M model does not improve on 123M here. This comparison gives us a result for this series, not a general ranking of the models. We chose 123M for the chart after comparing these results; there is no separate model-selection holdout. The historical split also cannot rule out overlap with the models' pretraining data.
The model works through Christmas
The uncertainty ranges deserve a check too. A nominal 80% range is a prediction we can evaluate:
| Model | Observations inside q10–q90 |
|---|---|
| 5M | 72.3% |
| 28M | 74.2% |
| 123M | 76.1% |
| 209M | 76.9% |
The ranges are useful, but they cover fewer than 80% of the observed counts in this backtest. They should not be treated as guarantees.
The largest miss for 123M is December 25, 2025. It predicts 244.6 AI-related submissions, with a range of 207.5 to 285.1. The classified count is 117.
Apparently, some people spend Christmas with their families instead of discussing inference costs. The model did not sufficiently budget for this possibility.
It captures the recurring weekly rhythm much better than that holiday dip. This extension forecasts a single numerical series per group; it does not currently expose extra inputs such as holiday flags or launch calendars. A sudden announcement can also change the conversation faster than its recent cadence suggests.
Keep the workflow in SQL
The useful part is the distance between the question and the result.
Jev turns a condition about text into a numeric column. DuckDB groups that column into a daily series. Timestral forecasts it, and a join puts the predictions next to the observations. The same shape applies to support-ticket categories, customer feedback, or daily demand for a product: classify when needed, aggregate at a consistent frequency, forecast, and check against a baseline.
This is the same motivation behind our MATCH_RECOGNIZE extension: give the operation a SQL interface that reads like the question, close to the data it operates on. Timestral is still awaiting community-registry inclusion; these results use our source build.
The Timestral extension is MIT licensed; Mistral's weights have a separate Modified MIT license.
We now have a database that can estimate next week's AI chatter. Whether any of those posts will convince the commenters is a different forecasting problem.