Insights
Insights are the primary way to create persistent visualizations and analyses in Altertable. They are saved analytics views that help you track key metrics, understand trends, and make data-driven decisions.
What are Insights?
Insights transform raw data into actionable visualizations by:
- Query logic: query your lakehouse data using predefined logic
- Visualization types: support charts, tables, and metrics
- Refresh: refresh automatically or on-demand
- Sharing: share with teams and embed in external tools
Prerequisites: Insights analyze data in your lakehouse. Start by connecting external catalogs or creating an Altertable catalog.
Insight Types
Altertable offers semantic and SQL insight types for lakehouse data. For product-behavior analyses, see Product Analytics query data.
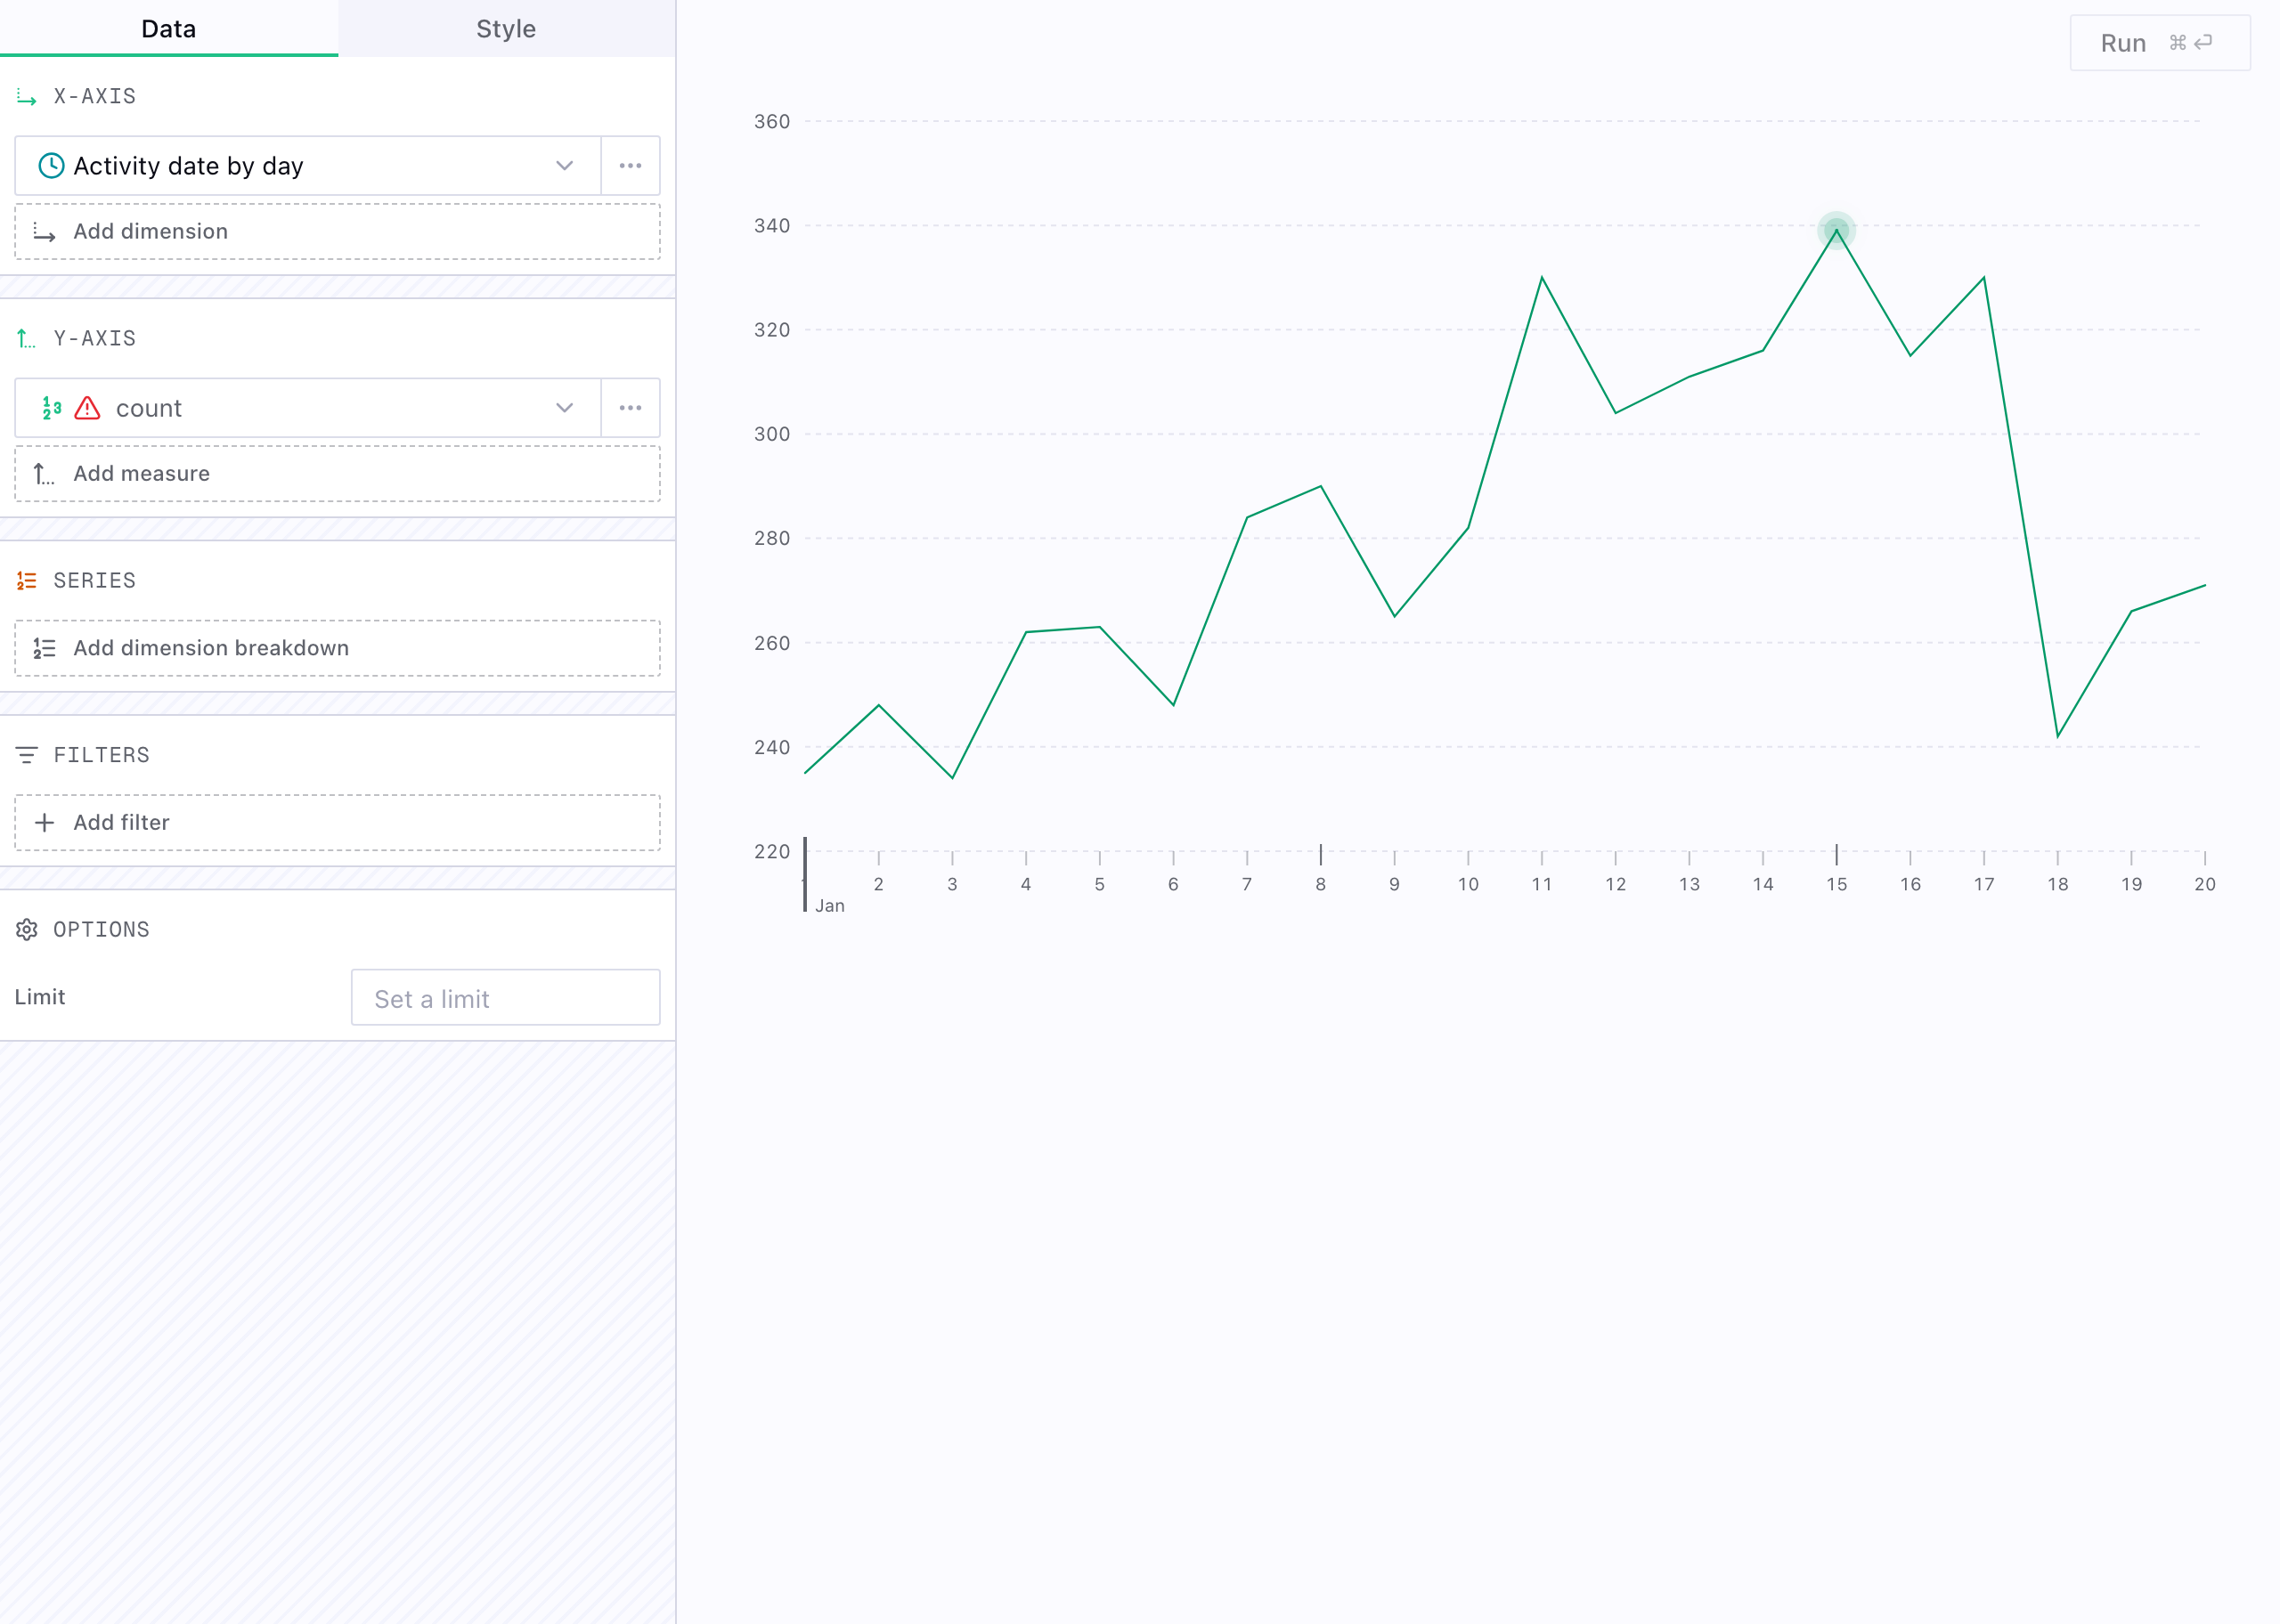
1. Semantic Insights
Semantic insights query semantic models using business-friendly metrics and dimensions—no SQL required. Define models, measures, and dimensions in the Semantic Layer, then pick them in the insight builder to chart KPIs and reports.
Best for:
- Business metric reporting
- KPI dashboards
- Cross-functional analytics
- Model-based queries
Example use cases:
- "What's our monthly recurring revenue by region?"
- "Show customer acquisition cost by marketing channel"
- "Track product adoption metrics over time"
2. SQL Insights
Execute custom SQL queries using DuckDB dialect for complete flexibility in data analysis.
Best for:
- Complex custom queries
- Ad-hoc analysis
- Advanced calculations (window functions, CTEs)
Capabilities:
- Full DuckDB SQL dialect support
- Cross-catalog federated queries
- Advanced analytics functions (window functions, CTEs, recursive queries)
- Complete query flexibility
Use cases:
- Custom time-series calculations with specific business rules
- Complex multi-source joins (events + CRM + revenue data)
- Advanced grouping analysis with custom time windows
- Performance analysis with moving averages and percentiles
Tasks on insights
Attach Tasks to insights to monitor them on a schedule:
- Trend detection: get notified when metrics change significantly
- Anomaly alerts: receive notifications when data deviates from patterns
- Scheduled reports: generate periodic summaries
Tasks send Notifications when they find something noteworthy.
Creating Insights
- Navigate to Insights
- Click New insight
- Choose Semantic or SQL
- Configure the query and chart
- Save and optionally attach a Task for monitoring
Learn More
- Dashboards: combine insights into shared layouts
- Tasks: scheduled monitoring on insights and other contexts
- Notifications: notifications from tasks on insights
- Memories: knowledge tasks build to improve monitoring over time
- Semantic Layer: define metrics, dimensions, and model structure for semantic insights
- Product Analytics query data: behavioral analysis over tracked product events
- Ask Agent: ask natural-language questions about your data
- Lakehouse: query and connect data to your lakehouse