Retention Insights
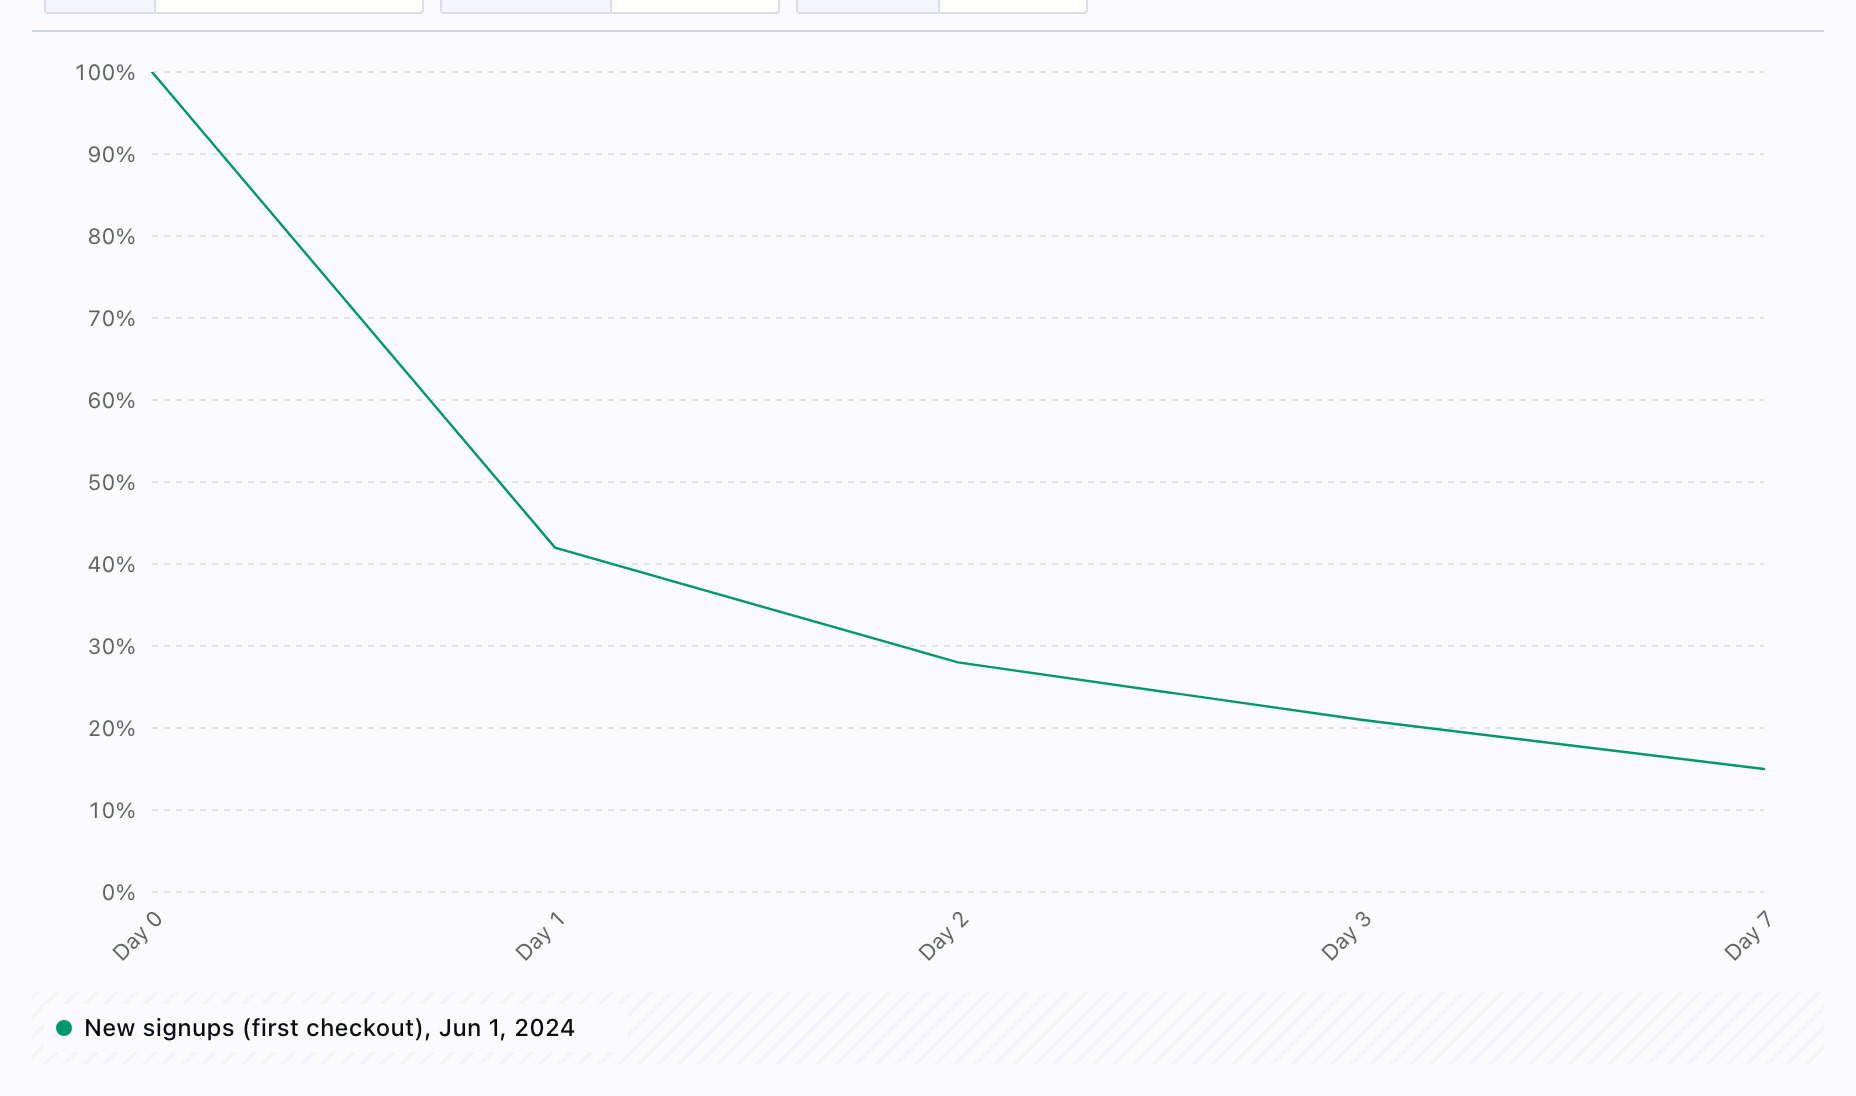
Retention insights plot classic cohort retention: users or other entities who did a starting event in a period, then whether they performed a returning event again in later time buckets. Use them to see whether new signups, activated users, or any cohort keep engaging over days or weeks.
Best for:
- Onboarding and activation ("did they come back after signup?")
- Habit and repeat usage ("after first purchase, when do they return?")
- Comparing cohorts side by side with Segmented by filters
Example questions:
- "What share of signups used the product again on day 1, 7, and 30?"
- "After a user's first key action, how does return behavior differ by plan or channel?"
Creating Retention Insights
- Open Insights and create or edit a chart.
- In the insight type control, choose Retention. The control is labeled "Retention insight" when selected.
- Configure Starting event: the action that puts users into the cohort, for example sign up or first purchase.
- Configure Returning event: the action that counts as "retained", often the same event as the starting event or a deeper engagement event.
- Set Measured as:
- Return on or after: a user counts as retained in a bucket if they performed the returning event on that day or any later bucket in the window.
- Return on: retained only if they performed the returning event in that specific bucket.
- Set Calculated by:
- 24-hour windows: periods are aligned in 24-hour windows from the cohort start.
- Strict calendar day: periods follow calendar days, which can differ from rolling 24-hour logic.
- Optionally add Segmented by segments to compare multiple cohort curves on the same chart.
- Use Query variables when your chart defines them, such as date range or interval, so the preview matches the period you care about.
The preview shows a cohort retention visualization. Use the Results tab for the table and SQL to inspect the generated queries.
How this differs from segmentation
Segmentation insights compare metrics and breakdowns over time. Retention insights are optimized for cohort × offset curves from exactly two events plus retention-specific measurement rules. Use segmentation when you are comparing groups on a single metric; use retention when the question is explicitly "of people who did X, what percentage did Y again after N days?"
Practical notes
- You must select both starting and returning events before the chart can run; the UI prompts you until both are set.
- Retention uses the same event-step builder as funnels, so you can filter each side of the definition by properties, traits, and segments.
- Numbers may not match other analytics products exactly, because Measured as, Calculated by, timezone, and event definitions all affect cohort math. Trends and relative comparisons should still be reliable when definitions are held constant.
Related
- Funnel insights: sequential steps and conversion, not cohort return over offsets
- Segmentation insights: time series and breakdowns
- Product analytics: track: instrumenting the events retention depends on